| Year | 2017 | 2018 | 2019 | 2020 | 2021 | 2022 | 2023 | 2024 | 2025 |
| Total | 1162 | 1358 | 1269 | 753 | 1057 | 1384 | 1229 | 1158 | 1136 |
| CTA (includes Airways) | 812 * | 706 ** | 422 | 294 | 350 | 557 | 532 | 471 | 517 |
| TMA | * included in 2017 CTA | ** included in 2018 CTA | 293 | 130 | 176 | 237 | 165 | 185 | 192 |
| CTR | * included in 2017 CTA | 285 | 289 | 194 | 291 | 333 | 255 | 265 | 211 |
| ATZ | 97 | 130 | 100 | 63 | 93 | 102 | 104 | 73 | 67 |
| MTA/Restricted/Danger Areas | 81 *** | 87 *** | 55 | 39 | 79 | 56 | 66 | 59 | 53 |
| Temporary Restricted/Danger Areas | *** included in 2017 Restricted/Prohibited/Danger Areas | *** included in 2018 Restricted/Prohibited/Danger Areas | 12 | 3 | 16 | 29 | 18 | 16 | 32 |
| TMZ | 57 | 76 | 47 | 15 | 35 | 43 | 69 | 68 | 43 |
| RMZ | 115 | 74 | 48 | 14 | 11 | 25 | 17 | 20 | 18 |
| CAS-T | 3 | 1 | 0 | 1 | 0 | 0 | 0 | ||
| UIR /OCA | 4 | 1 | 3 | 1 | 3 |
2025 reported infringements by month
| Airspace Type | Jan | Feb | Mar | Apr | May | Jun | Jul | Aug | Sep | Oct | Nov | Dec | Total |
| CTA | 27 | 27 | 55 | 61 | 68 | 42 | 55 | 52 | 48 | 28 | 32 | 22 | 517 |
| TMA | 12 | 11 | 22 | 24 | 22 | 9 | 21 | 22 | 11 | 14 | 16 | 8 | 192 |
| CTR | 8 | 14 | 12 | 21 | 33 | 24 | 15 | 27 | 23 | 15 | 17 | 2 | 211 |
| ATZ | 3 | 4 | 4 | 6 | 7 | 9 | 6 | 7 | 9 | 4 | 5 | 3 | 67 |
| MTA/Restricted/Danger Areas | 0 | 3 | 4 | 4 | 5 | 5 | 5 | 9 | 6 | 5 | 2 | 4 | 53 |
| Temporary Restricted/Danger Areas | 1 | 0 | 1 | 2 | 3 | 4 | 8 | 4 | 4 | 1 | 1 | 2 | 33 |
| TMZ | 2 | 3 | 3 | 4 | 4 | 4 | 5 | 7 | 6 | 0 | 3 | 2 | 43 |
| RMZ | 2 | 1 | 2 | 1 | 3 | 2 | 3 | 1 | 1 | 2 | 0 | 0 | 18 |
| CAS-T | 0 | 0 | 0 | 0 | 0 | 0 | 0 | 0 | 0 | 0 | 0 | 0 | 0 |
| UIR/OCA | 0 | 0 | 1 | 0 | 0 | 0 | 0 | 1 | 0 | 0 | 1 | 0 | 3 |
| Total | 55 | 63 | 104 | 123 | 145 | 99 | 119 | 130 | 109 | 69 | 77 | 43 | 1136 |
Reported infringement statistics relate to all infringements occurring in UK airspace and those in non-UK airspace which involve pilots holding a UK-issued pilot’s licence.
2024 reported infringements by month
| Airspace Type | Jan | Feb | Mar | Apr | May | Jun | Jul | Aug | Sep | Oct | Nov | Dec | Total |
| CTA | 30 | 14 | 27 | 38 | 70 | 67 | 56 | 58 | 48 | 32 | 22 | 9 | 471 |
| TMA | 10 | 8 | 6 | 16 | 24 | 24 | 26 | 23 | 20 | 9 | 13 | 6 | 185 |
| CTR | 12 | 8 | 11 | 15 | 45 | 41 | 37 | 31 | 21 | 21 | 16 | 7 | 265 |
| ATZ | 4 | 5 | 4 | 4 | 10 | 12 | 10 | 5 | 10 | 4 | 4 | 1 | 73 |
| MTA/Restricted/Danger Areas | 4 | 4 | 3 | 7 | 7 | 9 | 5 | 5 | 5 | 4 | 4 | 2 | 59 |
| Temporary Restricted/Danger Areas | 0 | 1 | 0 | 1 | 0 | 1 | 7 | 4 | 2 | 0 | 0 | 0 | 16 |
| TMZ | 4 | 3 | 3 | 9 | 5 | 7 | 10 | 10 | 3 | 11 | 1 | 2 | 68 |
| RMZ | 0 | 5 | 1 | 2 | 2 | 7 | 3 | 0 | 0 | 0 | 0 | 0 | 20 |
| CAS-T | 0 | 0 | 0 | 0 | 0 | 0 | 0 | 0 | 0 | 0 | 0 | 0 | 0 |
| UIR/OCA | 0 | 0 | 0 | 0 | 0 | 0 | 0 | 0 | 0 | 0 | 0 | 1 | 1 |
| Total | 64 | 48 | 55 | 92 | 163 | 168 | 154 | 136 | 109 | 81 | 60 | 28 | 1158 |
Reported infringement statistics relate to all crewed aircraft infringements occurring in UK airspace and those in non-UK airspace which involve pilots holding a UK-issued pilot’s licence.
2023 reported infringements by month
| Airspace Type | Jan | Feb | Mar | Apr | May | Jun | Jul | Aug | Sep | Oct | Nov | Dec | Total |
| CTA | 30 | 23 | 30 | 58 | 62 | 88 | 53 | 46 | 49 | 38 | 40 | 15 | 532 |
| TMA | 10 | 13 | 15 | 18 | 14 | 23 | 13 | 19 | 14 | 7 | 12 | 7 | 165 |
| CTR | 13 | 18 | 11 | 20 | 37 | 47 | 25 | 22 | 28 | 21 | 11 | 3 | 256 |
| ATZ | 5 | 5 | 6 | 18 | 8 | 14 | 4 | 15 | 10 | 13 | 5 | 1 | 104 |
| MTA/Restricted/Danger Areas | 6 | 6 | 4 | 3 | 11 | 7 | 5 | 7 | 5 | 9 | 1 | 3 | 67 |
| Temporary Restricted/Danger Areas | 1 | 1 | 1 | 0 | 4 | 2 | 3 | 5 | 1 | 0 | 0 | 0 | 18 |
| TMZ | 3 | 3 | 1 | 6 | 6 | 8 | 13 | 6 | 10 | 6 | 1 | 6 | 69 |
| RMZ | 1 | 0 | 2 | 3 | 2 | 0 | 1 | 1 | 3 | 4 | 0 | 0 | 17 |
| CAS-T | 0 | 0 | 0 | 0 | 0 | 0 | 0 | 0 | 0 | 0 | 0 | 0 | 0 |
| UIR/OCA | 0 | 0 | 0 | 1 | 0 | 1 | 0 | 0 | 0 | 0 | 1 | 0 | 3 |
| Total | 69 | 69 | 70 | 127 | 143 | 190 | 117 | 121 | 120 | 98 | 71 | 34 | 1231 |
Reported infringement statistics relate to all infringements occurring in UK airspace and those in non-UK airspace which involve pilots holding a UK-issued pilot’s licence.
2022 reported infringements by month
| Jan | Feb | Mar | Apr | May | Jun | Jul | Aug | Sep | Oct | Nov | Dec | Total | |
| CTA (includes airways) | 19 | 29 | 32 | 44 | 78 | 81 | 73 | 71 | 52 | 39 | 24 | 15 | 557 |
| TMA | 10 | 11 | 21 | 22 | 36 | 22 | 25 | 30 | 16 | 21 | 13 | 10 | 237 |
| CTR | 25 | 10 | 35 | 29 | 39 | 34 | 53 | 40 | 23 | 20 | 19 | 7 | 333 |
| ATZ | 11 | 1 | 7 | 10 | 10 | 8 | 9 | 9 | 9 | 12 | 11 | 5 | 102 |
| Restricted/Prohibited/Danger Areas | 5 | 4 | 5 | 2 | 3 | 7 | 4 | 6 | 5 | 4 | 4 | 6 | 56 |
| Temporary Restricted/Prohibited/Danger Areas | 2 | 1 | 0 | 1 | 2 | 3 | 9 | 3 | 5 | 1 | 2 | 0 | 29 |
| TMZ | 2 | 1 | 1 | 2 | 5 | 10 | 4 | 5 | 7 | 4 | 1 | 1 | 43 |
| RMZ | 0 | 1 | 3 | 4 | 1 | 2 | 5 | 4 | 0 | 2 | 2 | 1 | 25 |
| CAS-T | 1 | 0 | 0 | 0 | 0 | 0 | 0 | 0 | 0 | 0 | 0 | 0 | 1 |
| UIR (Upper Information Region) | 0 | 0 | 1 | 0 | 0 | 0 | 0 | 0 | 0 | 0 | 0 | 0 | 1 |
| Total reported airspace infringements | 75 | 58 | 105 | 114 | 174 | 167 | 182 | 168 | 117 | 103 | 76 | 45 | 1384 |
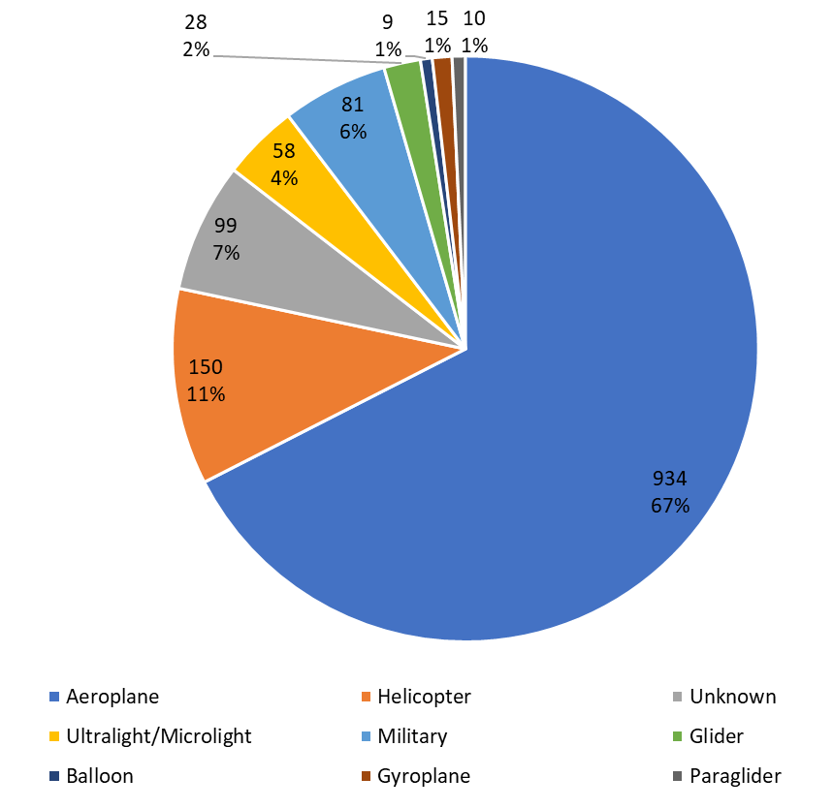
By aircraft type
2021 reported infringements by month
| Jan | Feb | Mar | Apr | May | Jun | Jul | Aug | Sep | Oct | Nov | Dec | Total | |
| CTA (includes airways) | 3 | 4 | 10 | 47 | 32 | 51 | 49 | 49 | 25 | 33 | 32 | 15 | 350 |
| TMA | 2 | 3 | 6 | 16 | 19 | 25 | 17 | 22 | 25 | 16 | 17 | 8 | 176 |
| CTR | 8 | 3 | 14 | 23 | 30 | 37 | 28 | 38 | 32 | 37 | 29 | 12 | 291 |
| ATZ | 1 | 2 | 3 | 7 | 12 | 15 | 11 | 12 | 11 | 8 | 10 | 3 | 95 |
| Restricted/Prohibited/Danger Areas | 3 | 4 | 3 | 6 | 7 | 11 | 19 | 13 | 1 | 4 | 6 | 2 | 79 |
| Temporary Restricted/Prohibited/Danger Areas | 0 | 0 | 0 | 1 | 0 | 1 | 3 | 1 | 5 | 1 | 4 | 0 | 16 |
| TMZ | 0 | 0 | 1 | 1 | 8 | 5 | 4 | 3 | 4 | 3 | 4 | 2 | 35 |
| RMZ | 0 | 3 | 2 | 0 | 1 | 0 | 1 | 1 | 1 | 0 | 1 | 1 | 11 |
| CAS-T | 0 | 0 | 0 | 0 | 0 | 0 | 0 | 0 | 0 | 0 | 0 | 0 | 0 |
| UIR (Upper Information Region) | 1 | 0 | 0 | 0 | 0 | 1 | 0 | 1 | 0 | 1 | 0 | 0 | 4 |
| Total | 18 | 19 | 39 | 101 | 109 | 146 | 132 | 140 | 104 | 103 | 103 | 43 | 1057 |
2020 reported infringements by month
| Jan | Feb | Mar | Apr | May | Jun | Jul | Aug | Sep | Oct | Nov | Dec | Total | |
| CTA (includes airways) | 23 | 9 | 19 | 4 | 20 | 20 | 54 | 29 | 53 | 33 | 14 | 16 | 294 |
| TMA | 9 | 9 | 14 | 3 | 3 | 7 | 29 | 15 | 14 | 14 | 8 | 5 | 130 |
| CTR | 9 | 6 | 22 | 2 | 20 | 18 | 32 | 26 | 22 | 16 | 14 | 7 | 194 |
| ATZ | 2 | 5 | 7 | 1 | 1 | 7 | 13 | 3 | 12 | 3 | 5 | 4 | 63 |
| Restricted/Prohibited/Danger Areas | 2 | 2 | 2 | 0 | 4 | 2 | 3 | 5 | 6 | 5 | 3 | 5 | 39 |
| Temporary Restricted/Prohibited/Danger Areas | 0 | 0 | 0 | 0 | 0 | 0 | 0 | 0 | 3 | 0 | 0 | 0 | 3 |
| TMZ | 0 | 1 | 0 | 0 | 0 | 0 | 1 | 3 | 4 | 6 | 0 | 0 | 15 |
| RMZ | 0 | 0 | 0 | 0 | 0 | 2 | 3 | 3 | 4 | 2 | 0 | 0 | 14 |
| CAS-T | 0 | 0 | 0 | 0 | 0 | 0 | 0 | 1 | 0 | 0 | 0 | 0 | 1 |
| Total | 45 | 32 | 64 | 10 | 48 | 56 | 135 | 85 | 118 | 79 | 44 | 37 | 753 |
2019 reported infringements by month
| Jan | Feb | Mar | Apr | May | Jun | Jul | Aug | Sep | Oct | Nov | Dec | Total | |
| CTA (includes airways) | 29 | 23 | 24 | 40 | 63 | 39 | 59 | 65 | 34 | 26 | 8 | 12 | 422 |
| TMA | 13 | 21 | 26 | 21 | 31 | 39 | 37 | 41 | 28 | 17 | 11 | 8 | 293 |
| CTR | 9 | 22 | 14 | 34 | 35 | 30 | 34 | 39 | 29 | 16 | 13 | 14 | 289 |
| ATZ | 5 | 4 | 5 | 9 | 12 | 12 | 18 | 13 | 6 | 10 | 2 | 4 | 100 |
| Restricted/Prohibited/Danger Areas | 2 | 0 | 7 | 3 | 6 | 8 | 8 | 3 | 1 | 11 | 2 | 4 | 55 |
| Temporary Restricted/Prohibited/Danger Areas | 1 | 0 | 0 | 1 | 0 | 3 | 3 | 2 | 0 | 2 | 0 | 0 | 12 |
| TMZ | 3 | 4 | 5 | 5 | 7 | 5 | 5 | 6 | 4 | 0 | 1 | 2 | 47 |
| RMZ | 1 | 3 | 2 | 4 | 5 | 10 | 10 | 10 | 2 | 0 | 0 | 1 | 48 |
| CAS-T | 0 | 0 | 0 | 1 | 0 | 0 | 1 | 0 | 0 | 0 | 0 | 1 | 3 |
| Total reported airspace infringements | 63 | 77 | 83 | 118 | 159 | 146 | 175 | 179 | 104 | 82 | 37 | 46 | 1269 |